Novel Remote Sensing Techniques for Measuring Destruction in Gaza
November 17, 2025
This research was conducted for my final project in Geography 051 at Dartmouth College. However, the content of this research does not necessarily reflect the views of Dartmouth College or my professor(s).
This blog has traditionally been a space for me to reflect upon and recount my cycling endeavors. Yet, I believe it is important to publish this research online as it is the first and only publicly available open-source destruction map of Gaza with a building-by-building resolution. What is the purpose of having a platform if I do not use it? One who fails to stand for something stands for nothing.


Gaza City: October 6, 2023 (pre-war) and October 6, 2025 (‘post-war’)
Abstract
Israel’s aerial bombardment of Gaza following Hamas’s October 7, 2023, attack has resulted in unprecedented destruction in the Gaza Strip. A cursory glance at an aerial photo is enough to reveal that the majority of the infrastructure in the Gaza Strip has been reduced to rubble. The purpose of this study is to go further by quantifying damage on a building-by-building basis. In this study, I attempt to replicate current urban destruction techniques and evaluate the accuracy of novel urban destruction techniques. I create a multi-sensor optical and radar change detection classifier and an optical-only damage detection classifier that has an 88.52% validation accuracy. I also measure destruction using Synthetic Aperture Radar, Visible Infrared Imaging Radiometer Suite (VIIRS), and optical classification. Additionally, I quantify changes to Gaza’s arable land to contribute to the broader narrative of Israel’s attempt to erase the Palestinian People and the Palestinian State. I find that 73.03% of buildings in Gaza have been severely damaged, and 96.28% of agricultural lands have been destroyed. This is the first and only open-source publicly available destruction map with a building-by-building resolution.
Background and Literature Review
In the wake of Hamas’s and other militant groups’ October 7th, 2023, terrorist attack on Israel’s southern envelope in which Hamas murdered 1,200 Israelis and kidnapped 251 hostages, Israel launched a protracted military offensive operation with the stated aim of destroying the Hamas militant group and recovering the hostages taken during Hamas’s attack (Bisset et al. 2025). For the past 2 years, Israel has bombarded the 140-square-mile Gaza Strip with a siege, a ground invasion, and intense airstrikes (Congress, 2025). At least 67,000 Palestinians have died, including 20,000 children; 124 hospitals have been destroyed, 89% of water and sanitation infrastructure has been destroyed, and widespread famine has beset the Gaza Strip (Ali, 2025). A UN committee, Amnesty International, and 86% of genocide scholars consider Israel’s actions a genocide against the Palestinian People (Nader, 2025). Reports estimate that Israel has dropped over 200,000 tons of explosives on the Gaza Strip since October 7–the equivalent of 12 nuclear bombs (Basal, 2025). Because Israel has not allowed, and continues to bar foreign journalists from the Gaza Strip, there is limited ground truth knowledge on the extent of the destruction caused by Israel’s offensive. Even death tolls are wildly variable and likely a gross underestimate (Ali, 2025). Hence, remote sensing techniques are invaluable in assessing the physical damage to the Gaza Strip. Two major studies have employed remote sensing techniques to measure destruction: Corey Scher and Jamon Van Den Hoek’s ‘Active InSAR monitoring of building damage in Gaza during the Israel-Hamas War’–which has been widely cited and has almost unilaterally established the baseline destruction estimates found in the literature–and the United Nations Satellite Centre’s (UNOSAT) Comprehensive Damage Assessment. The most current figures on Gaza destruction come from Scher and Hoek’s paper and the UNOSAT report, which is updated monthly. However, Scher and Hoek’s paper only covers destruction through 2024. Destruction numbers have undoubtedly only risen since then, as the situation in Gaza is incredibly dynamic and Israel has continued its bombing campaign in Gaza–even after the October 2025 ‘ceasefire’ was signed (Tondo, 2025). Hence, the world largely relies on a single assessment for damage quantification in Gaza–a problematic dependency. Additionally, I have found limited information on remote sensing techniques other than InSAR as a means to measure destruction in Gaza. In this paper, I attempt to replicate Scher and Hoek’s InSAR monitoring, while also analyzing other remote sensing techniques that may be helpful in introducing novel evidence and contributing the the robustness of known destruction in Gaza.
As Palestinians begin to return to Khan Younis, Gaza City, and the Northern regions of the Gaza Strip following the recent ceasefire, they are returning to uncertainty and loss. Understanding the severity and extent of the destruction is incredibly important as Gazans begin to return and prepare to rebuild their homes. There is no publicly available data on what buildings are intact and what buildings are destroyed. I hope that the building-by-building granularity of my results may be a positive contribution to the literature. As such, I have published the results on my website.
To achieve the stated goal of quantifying destruction in Gaza to a building-size scale, I attempt to utilize remote sensing urban damage detection techniques to create an updated baseline understanding of current damage estimates. After replicating current remote sensing techniques, I research remote sensing methods that may be used to quantify urban damage, document their practicality, implement them on the Gaza Strip study area, and evaluate their accuracy. This project delivers a comprehensive overview of damage detection methods, their respective damage estimations, their estimated accuracy, and their practicability.
Methods
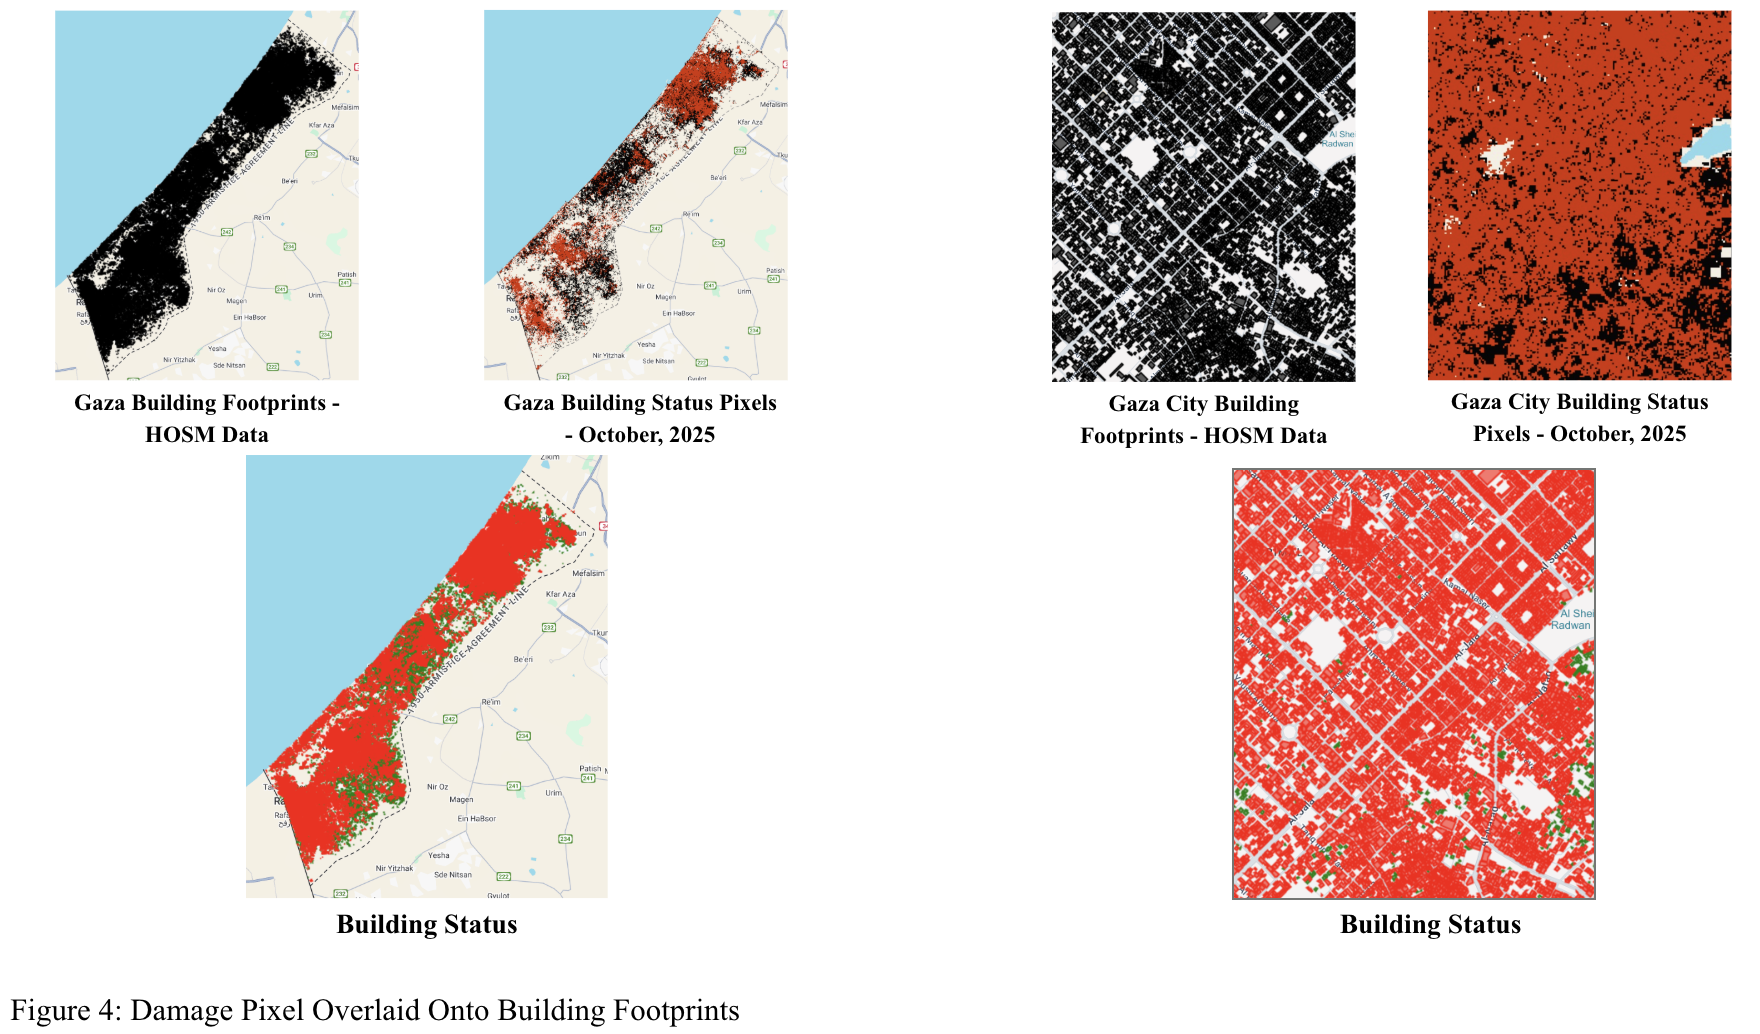
As noted, it is readily apparent that Gaza’s infrastructure has suffered extreme damage, both from simple satellite imagery and the limited ground truth media emerging from the strip. The challenge of this project is quantifying the destruction on a granular level. Crucial to the feasibility of a damage assessment at a building-by-building resolution is the Humanitarian OpenStreetMap Team’s (HOSM) ‘Gaza Building Footprints Pre Conflict’ dataset. I hypothesized that by overlaying damage detection layers onto known building footprints, I would be able to classify buildings as damaged or undamaged based on the damage layer each building footprint is clipped to. The method for damage detection quantification was hence established and normalized across novel remote sensing techniques. I was able to begin generating damage estimation layers utilizing varying remote sensing techniques.
When selecting remote sensing techniques to measure urban damage, my first aim was to replicate past studies. To complete an InSAR coherence analysis, I used Alaska Satellite Facilities' Vertex software to conduct c-Band L1 Single Look Complex (SLC) Interferometric SAR (InSAR) Coherence analysis on 25 pre-war and 25 post-war image pairs. However, when I exported the results of the InSAR coherence analysis into Colab (Refer to Appendix B for code), it became immediately clear that the images were not correctly aligned. Even small discrepancies in geolocation render InSAR wildly inaccurate. I couldn’t properly align the photos, so damage estimates are wildly underestimated. Nonetheless, some damage is optically visible in Figure 1, which shows a damage estimate for the Gaza Strip.
To develop novel remote sensing techniques for the Gaza Strip, I started by thinking about what unique signatures destroyed buildings might have over intact buildings, both optically and otherwise. I came up with Figure 12 (Appendix B). I then combined all of the optical measures into one classifier on Google Earth Engine. Using Sentinel-2 as my optical imagery collection, I added NDVI, NDBI, BSAVI, SWIR, NBR, dNBR, NDWI, and false color bands to the classifier. I attempted to add a SAR band from Sentinel-1 to the classifier to make it multi-sensor, but the SAR band decreased the classifier's overall accuracy, so I removed it from the classifier. After training the classifier on hundreds of points and repeatedly tweaking the inputs, I got the classifier to an accuracy level that was as high as I deemed reasonably possible. The classifier returns pixels of 10mx10m size, as the Sentinel-2 imagery is 10m resolution. I filter the classifier to mask out all classified pixels except for destroyed infrastructure and intact infrastructure. By clipping the building footprints to the damage indicator pixels, I classify each building as intact or destroyed. If a shapefile even partially contains a damaged pixel, the building is designated as destroyed.
In Google Earth Engine, I also conducted a pre- and post-war nighttime lights using NOAA’s VIIRS sensor; however, the resolution is too coarse to be used in the classifier. Finally, I conducted a pre- and post-war agricultural land usage analysis using NDVI and NDBI to quantify agricultural land. I examined satellite imagery from March 2023 and March 2025 because March is at the end of Gaza’s rainy season, so agricultural land usage should be at its peak.
Results
InSAR damage detection analysis yielded no useful results other than the damage map in Figure 1 (refer to the appendix for all figures not displayed in text). There is damage evident over urban areas, but the change is minimal and useless for quantification purposes.

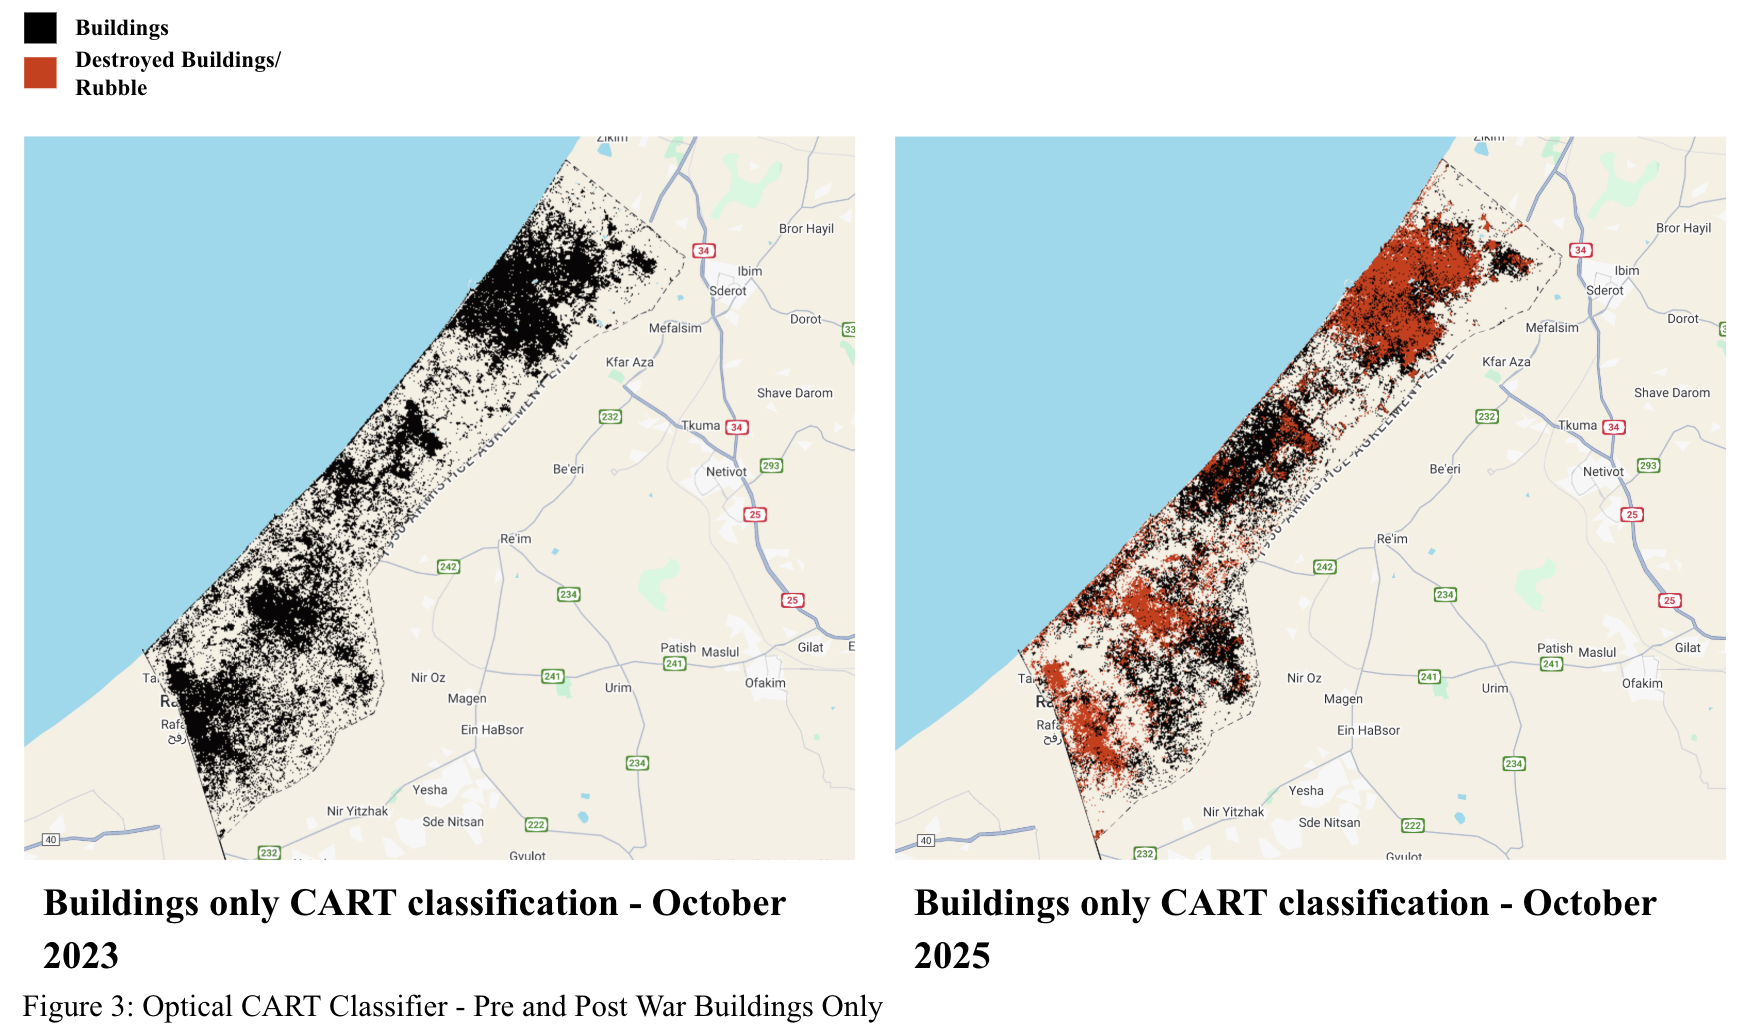
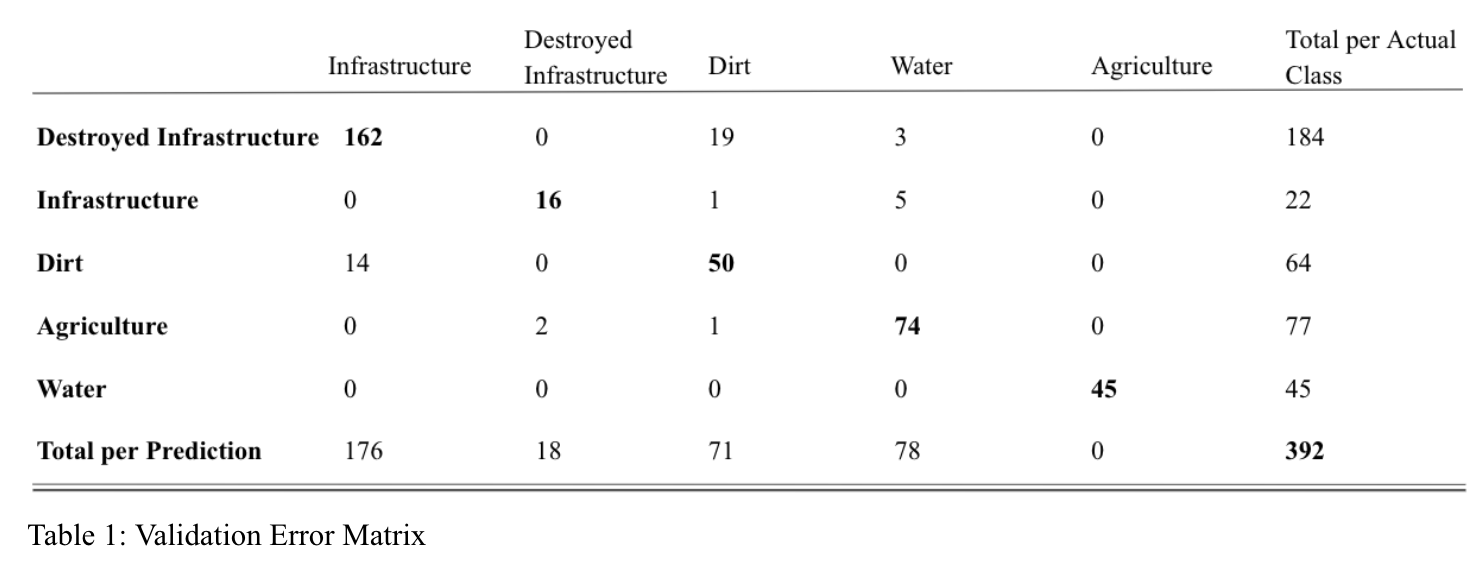
The optical classifier was significantly more accurate. With an overall accuracy of 88.52% and a destroyed infrastructure user’s accuracy of 92.0% and an intact infrastructure user’s accuracy of 88.9% (Table 2). While not perfect, this level of accuracy renders my classifier an incredibly useful tool, given that it is publicly available data for anyone on the internet to view. My classifier recognizes over 90% of known (HOSM baseline) buildings in the Gaza Strip (Table 3. Of the 295,709 buildings my classifier recognizes, 215,959, or 73.03% are damaged (Table 4). This compares to UNOSAT’s 81% damage estimate.
Figure 2 shows a pre-war and post-war land cover map using the optical classifier, and Figure 3 shows a building-only mask of this same time period. The extent of damage is evident from the damage pixels, but it is not until these damage pixels are clipped onto the building footprint shapefiles (Figure 4) that the extent of the damage becomes evident in Figure 5.
Understanding what parts of the Gaza Strip have been most heavily bombarded is incredibly important. In addition to providing valuable insights into where aid and redevelopment efforts will need to be concentrated, understanding the systematic aerial bombardment strategy of the Israel Defense Force (IDF) gives us deeper insight into the nature of this conflict and the forces that are driving it. Table 5 provides damage estimates for Gaza’s six largest cities, which can be seen in Figures 6 & 7. Note the increased damage estimates for cities in Northern Gaza. Gaza City, Gaza’s most populous city and only port, registers an 87.59% damage estimate, on par with UNOSAT’s 92% estimation.

Although there are minor monthly variations, the VIIRS change in nighttime brightness analysis yields a roughly 85% reduction in nighttime brightness across the Gaza Strip (Figures 8 & 9). A dramatic decrease in monthly nighttime brightness can be seen in October 2023. The average nighttime brightness has remained stable since then, except in January 2024, when there was a noticeable increase in nighttime brightness due to loosening adi restrictions by Israel, which were short-lived as shown by the immediate drop shortly thereafter. My 85% brightness decrease is consistent with the literature’s 85-92% decrease estimates (UNOSAT, 2025; CARE, 2024).
My agricultural land usage pre- and post-war analysis yields a 96.28% decrease in active agricultural lands from March 2023 until March 2025. There were 20,180 acres of active agricultural land in 2023, compared to 999 acres in 2024. Consistent with infrastructure damage estimates, agricultural damage is more intense in Northern Gaza (Figures 10 & 11). In 2025, just 1.08% of Gaza’s land is devoted to agriculture, compared to over 20% pre-war.

Discussion
While InSAR remains the most accurate and widely used urban damage detection technique, the novel optical classification technique presented in this paper provides robustness to current damage estimations. I am incredibly proud of the damage map I created. This is the coolest and most impactful project I have completed at Dartmouth. While far from perfect, I feel that I have created something novel that has the potential to have real impacts.
Before I discuss limitations and future directions, I would like to situate my findings in the broader context of the Israel-Palestine conflict. Israel’s protected offensive military campaign in the Gaza Strip following the October 7th Attacks is now widely considered a genocide. Some Israeli ministers and IDF generals have openly stated that military ambitions in the Gaza Strip are an attempt to erase the Palestinian people from the Palestinian state (many right-wing Israelis deny that there is a Palestinian people or a Palestinian State to begin with, a point echoed by Golda Meir). The Israeli Government’s Gaza 2035 proposal lays out plans to annex the Gaza Strip and turn Gaza into a “real estate bonanza” for Israel, according to Israeli Finance Minister Bezalel Smotrich, who stated, “The demolition phase has already been completed, which we all know is the first step of urban renewal.” Damage estimates in this project highlight a clear attempt by the Israeli Government to go beyond a standard military operation. The intentional targeting of agricultural land is an obvious attempt to erase Israeli means of production, rendering the Gaza Strip an inhospitable place, denying Palestinians a right of existence by controlling every aspect of subsistence. The systematic destruction of cities in Northern Gaza is a clear strategy to force Palestinians south, squeezing them out of the country. Israel’s targeting of energy infrastructure, as revealed by my VIIRS analysis, is also a clear example of systematic disruption and destruction of the Palestinian State; a strategy to make Gaza an unlivable region for the indigenous peoples, the Palestinians.


I believe my damage estimate is lower than other estimates in the literature because my optical classifier is trained on such coarse (10-meter) imagery that it only recognizes damage as complete destruction. My classifier likely only detects buildings that are reduced to rubble, and not buildings that have substantial, but not complete, damage. While I can not state this with certainty since ground truthing is impossible, my classifier is likely not a damage estimation, but a destruction estimation. I used Maxar Worldview 3 imagery on the Google Earth satellite basemap with a 30cm resolution to train my model and try to ground-truth, but I did not run any statistical tests using detailed resolution imagery. It would be interesting to run this classifier on Worldview 3 imagery. I assume my damage estimations would increase by 10-15%.
I hypothesize that the most accurate remote sensing technique for urban damage detection is Lidar, which would provide detailed 3D maps. Even without a pre-war comparison map, a high-resolution Lidar map could detect jagged edges of damaged buildings and rubble piles with ease. However, even the most accurate remote sensing damage detection techniques are limited because many buildings may have damage that is not visibly detectable, such as internal instability or unstable foundations. Hence, all remote sensing damage estimates are likely underestimations of the actual damage.
This work continues to be timely and necessary even though Israel and Hamas have signed a ceasefire. Since the ceasefire was signed on October 10th, 2025, Israel has violated the agreement at least 393 times (AJLabs, 2025). Gazans have begun returning to the Gaza Strip, but uncertainty awaits many Palestinians. Understanding how and where the Gaza Strip has been damaged is essential to understanding this conflict and hopefully restoring justice for the Palestinian people who have lost lives, property, and freedom.
Note: to view the destruction map, follow the link to my Google Earth Engine code in Appendix B. Open the “Classifier” file in the EARS 65 Repository. Click “Run” and wait for the program to process the code. It may take several minutes for the classifier to run.
Acknowledgements
I used ChatGPT and xAI to write and troubleshoot parts of my code. AI was only used when I wrote code; no other parts of this project were completed with AI.
References
Al Jazeera. (2025, October 26). Unexploded Israeli bombs threaten lives as Gaza clears debris,
finds bodies. https://www.aljazeera.com/news/2025/10/26/unexploded- israeli-bombs- threaten-lives-as-gaza-clears-debris-finds-bodies
Al Jazeera. (2025, November 11). How many times has Israel violated the Gaza ceasefire? Here
are the numbers. https://www.aljazeera.com/news/2025/11/11/how-many-times -has-israel-violated-the-gaza-ceasefire-here-are-the-numbers
CARE. (2025, November 10). Gaza: 5 months of darkness seen from 500 miles above Earth.
https://www.care.org/news-and-stories/gaza-5-months-of-darkness-seen-from-500-miles-above-earth/
Congressional Research Service. (2024, October 4). *Israel and Hamas conflict in brief:
Overview, U.S. policy, and options for Congress* (CRS Report No. R47828). https://www.congress.gov/crs-product/R47828
Estrin, D. (2025, November 7). An NPR reporter's journey into Gaza, for the first time since the
war began. *NPR*. https://www.npr.org/2025/11/07/nx-s1-5600831/gaza- israel-journalists
Gaza Strip. (n.d.). In *Encyclopædia Britannica*. Retrieved November 16, 2025, from
https://www.britannica.com/place/Gaza-Strip
Humanitarian OpenStreetMap Team. (n.d.). *State of Palestine buildings (OpenStreetMap
export)* [Data set]. Humanitarian Data Exchange. https://data.humdata.org/dataset/hotosm_pse_buildings
Scher, C., & Hoek, J. V. D. (2025). Active InSAR monitoring of building damage in Gaza during
the Israel-Hamas War. arXiv preprint arXiv:2506.14730.
SimpleMaps.com. (2025). *Free GIS maps of Palestine* [Data set]. Pareto Software, LLC.
https://simplemaps.com/gis/country/ps
The Guardian. (2025, October 29). Israel strikes Gaza again after overnight bombardment that
killed at least 104. https://www.theguardian.com/world/2025/oct/29/israeli-strikes- in-gaza-overnight-as-ceasefire-looks-increasingly-fragile
UNOSAT. (2025, October 31). *Gaza Strip comprehensive damage assessment* [Satellite
imagery assessment]. https://unosat.org/products/4213
Appendix A


Appendix B
Link to Google Earth Engine code repository for classifiers, VIIRS, and agricultural damage code.
Link to Colab notebook for InSAR analysis. Note: code is accurate, but data is not.
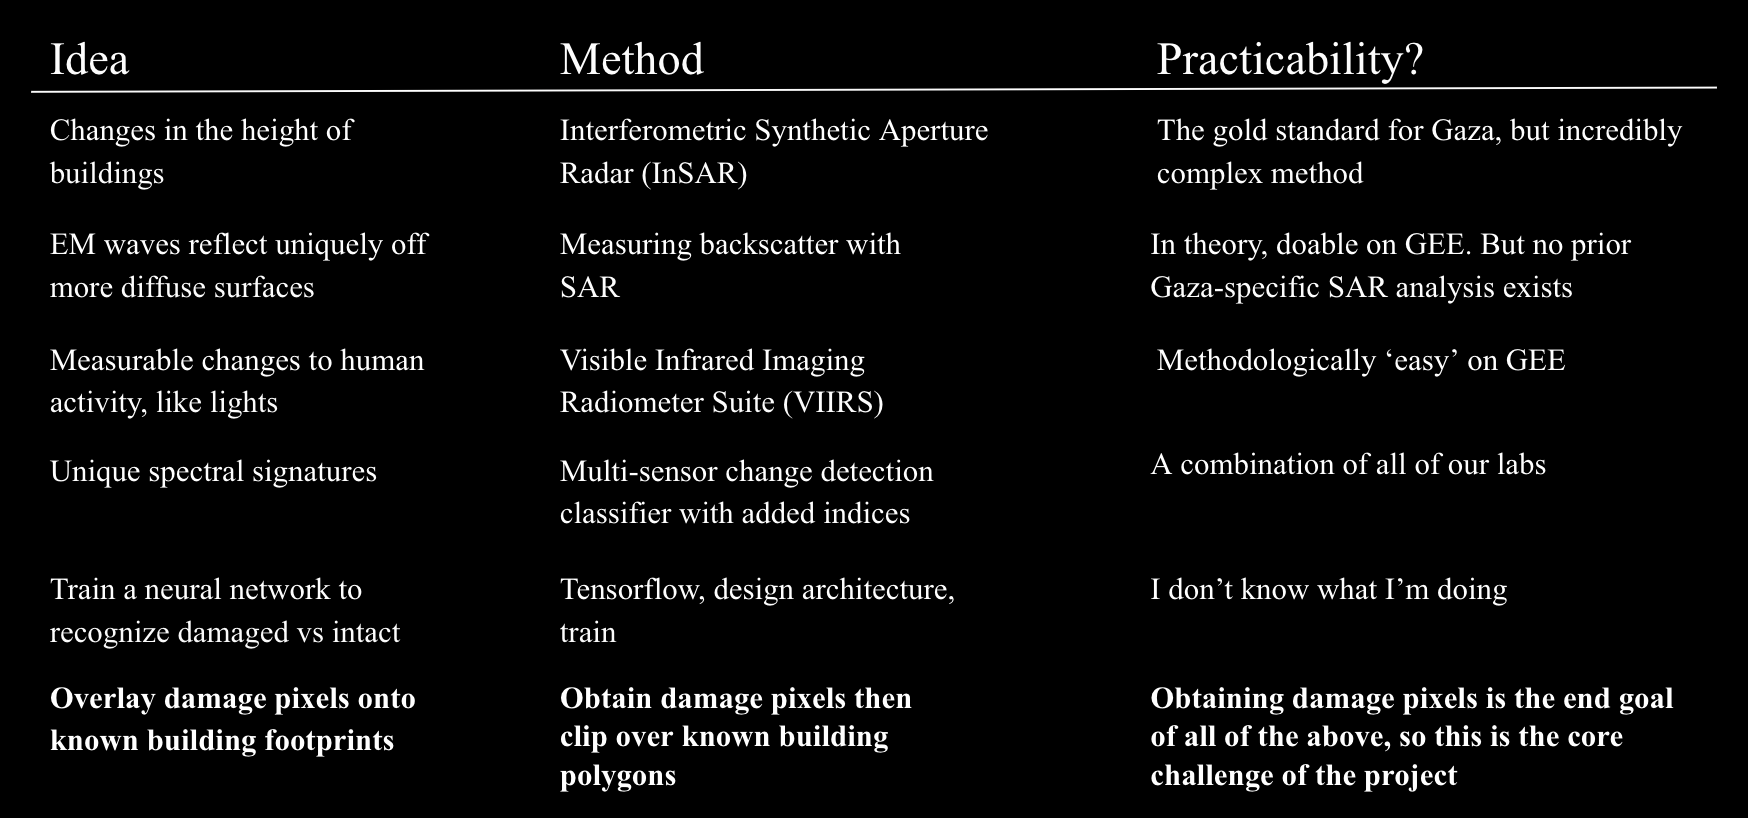
Figure 12